Timing can be everything. This may especially be true for home buyers.
You can get a better deal relative to different times of the year if you know the peaks and valleys of the real estate market. Data provider Attom analyzed nearly 48 million property sales from 2013 to 2022 to determine the best and worst times for house hunters.
If you’re looking to purchase a home, see when recent history says is the cheapest time and where your state lands.
Check your home buying options. Start hereBest times for home buyers
Like other sectors, real estate ebbs and flows seasonally. That means housing prices, the amount of available for-sale listings and competition can vary based on time of year. And it differs by location.
Knowing when you can typically get a good deal on a home in your area could end up saving you thousands of dollars. Attom’s report compared median home sales prices to the median automated valuation models (AVM) at the time of close. (A discount occurs when the sales price comes in below the AVM and premiums are above.)
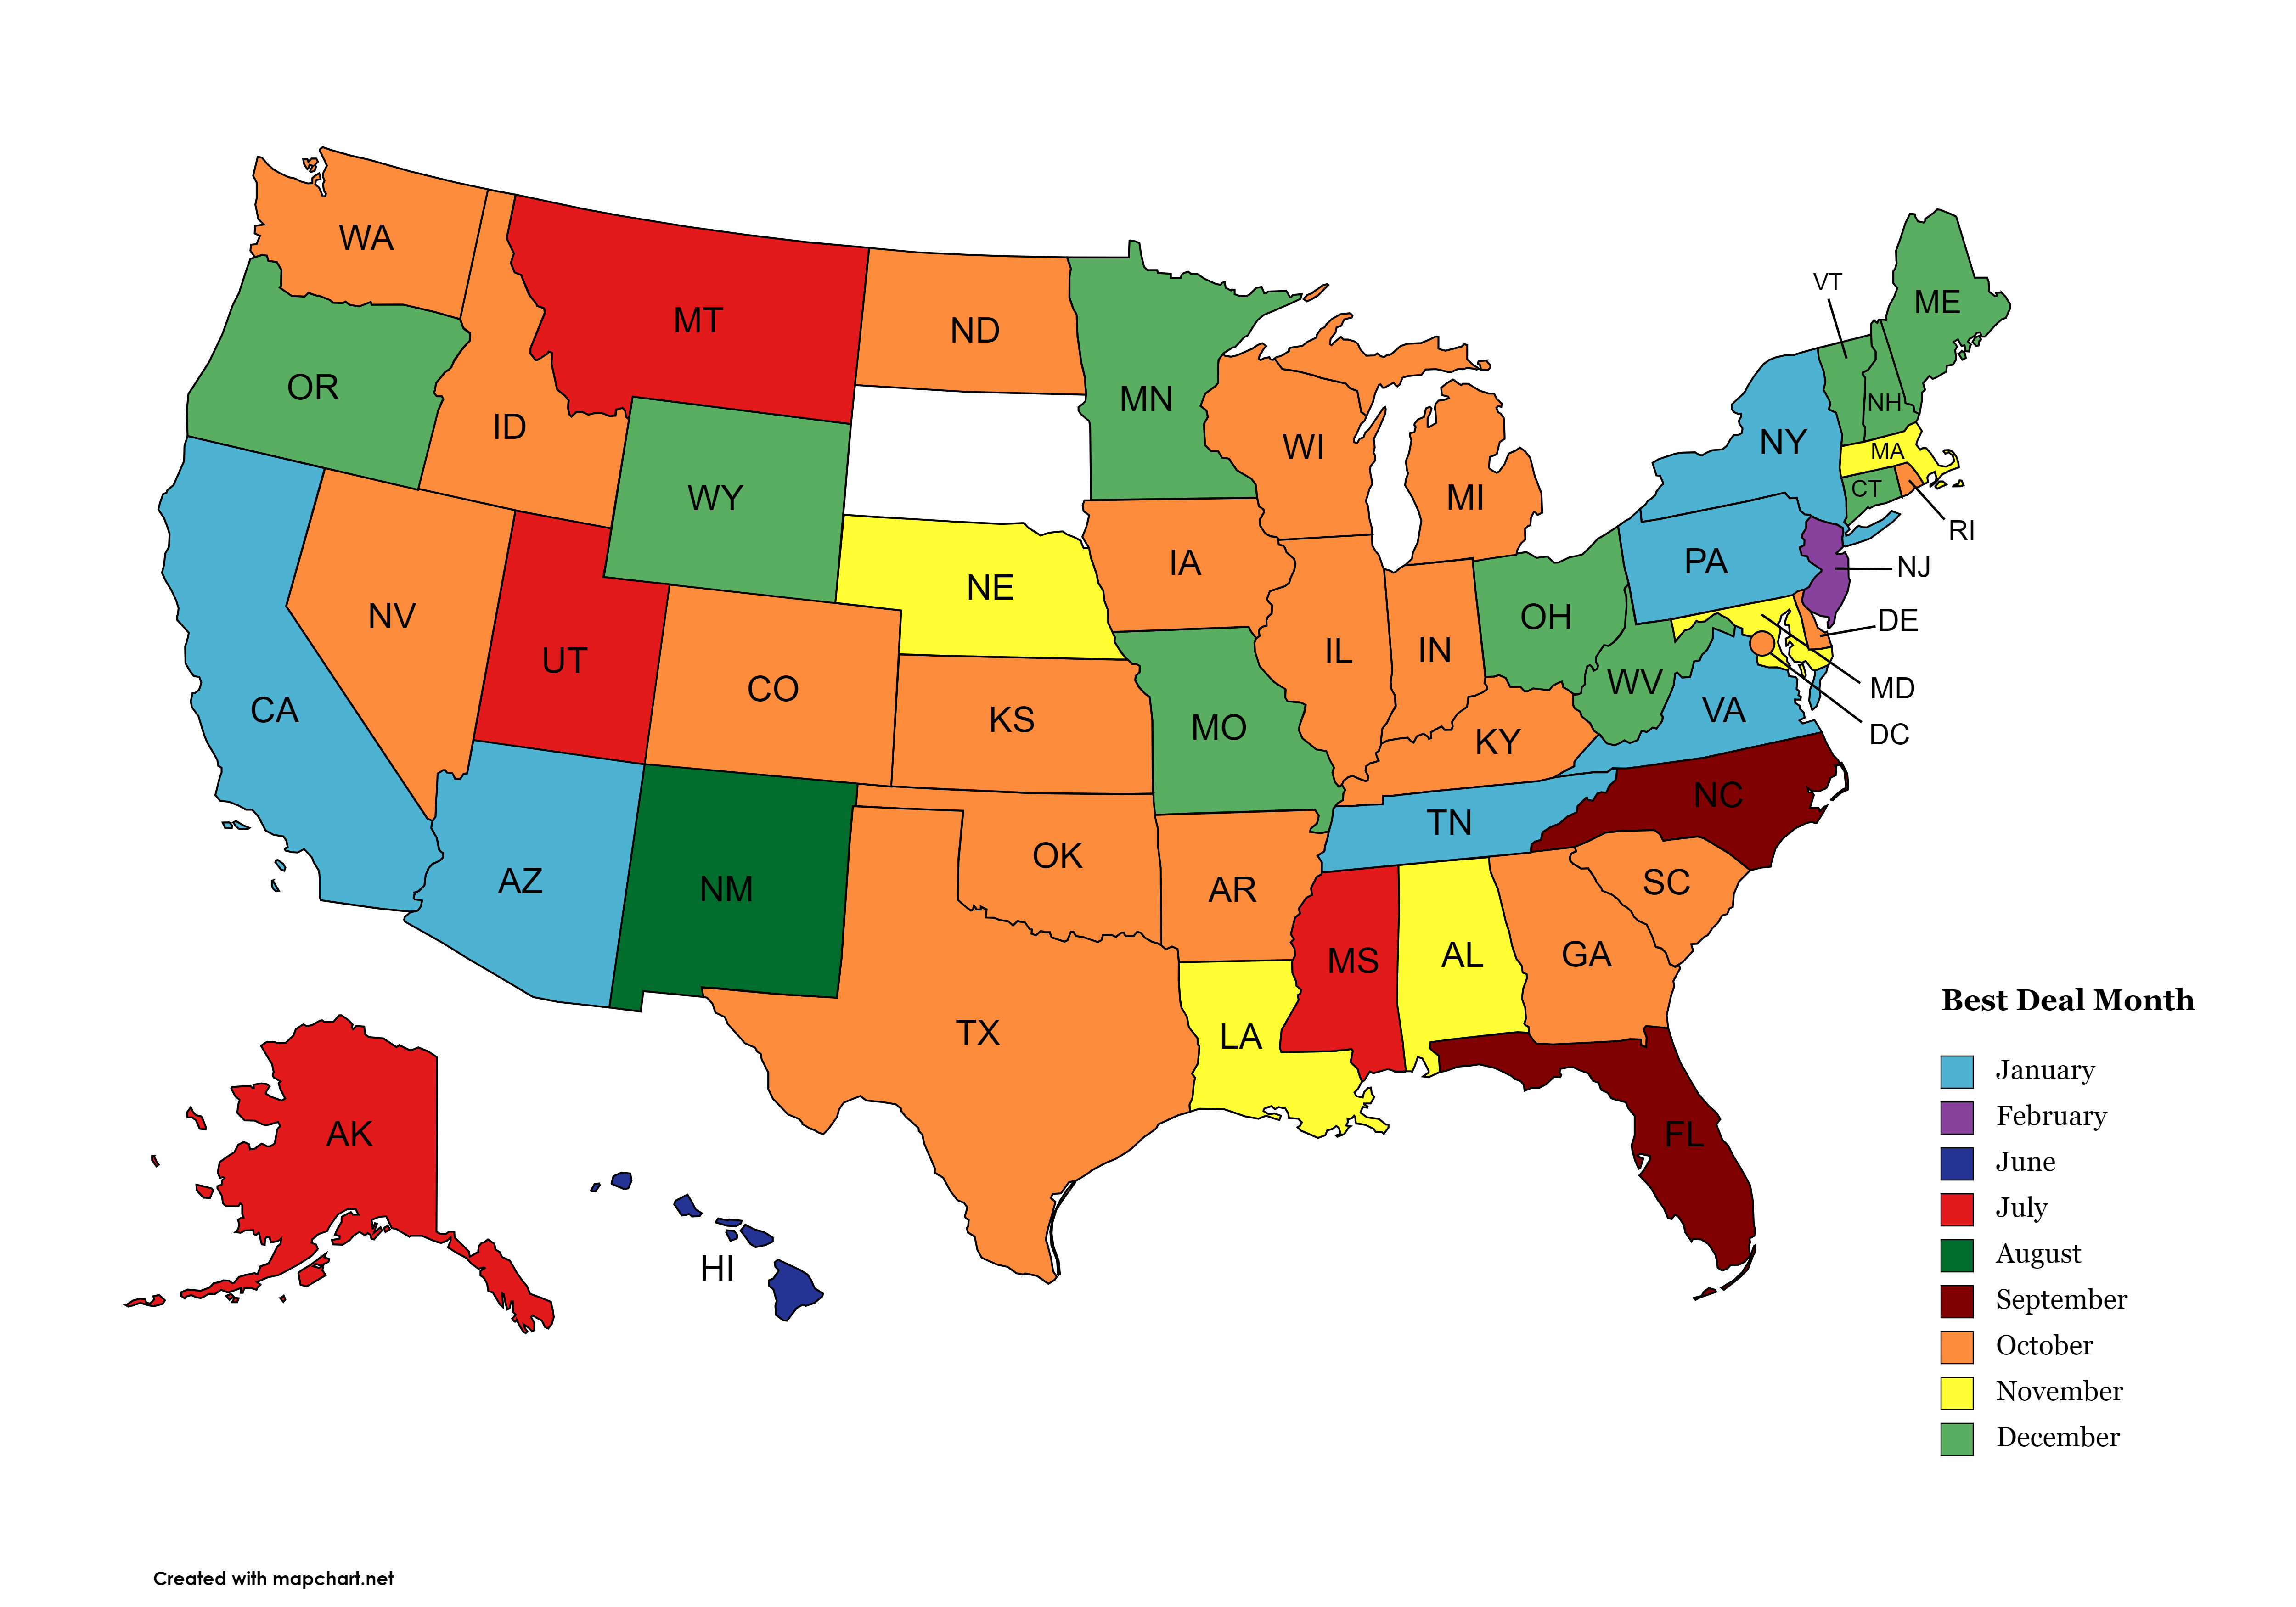
By state and month, Michigan led the nation with a 2.6% discount in October. The rest of the top five included New Hampshire’s 2.09% discount in December, Hawaii’s 1.8% in June, New Jersey’s 1.72% in February, and Illinois’ 1.6% in October.
The chart below shows every state’s best month for home buying deals:

Across the U.S. overall, October provided borrowers with the best time to purchase a property, with an average premium of 6.16%. Perhaps appropriately, it was flanked by September and November, both with premiums of 6.82%.
| Month | Premium | Month | Premium |
| January | 8.04% | July | 8.11% |
| February | 9.25% | August | 7.58% |
| March | 9.76% | September | 6.82% |
| April | 9.65% | October | 6.16% |
| May | 10.32% | November | 6.82% |
| June | 9.20% | December | 6.92% |
Broken down more granularly, Jan. 9 came out as the top day for home buyers, with a 3.8% premium. Dec. 4 and Oct. 9 followed, with premiums of 4.36% and 4.4%, respectively. Below are the top 12 days for home buying deals, according to Attom’s data:
| Day | Premium | Day | Premium |
| Jan. 9 | 3.83% | Dec. 26 | 4.95% |
| Dec. 4 | 4.36% | Nov. 13 | 4.98% |
| Oct. 9 | 4.40% | Dec. 24 | 5.11% |
| Oct. 2 | 4.48% | Oct. 16 | 5.16% |
| Oct. 10 | 4.48% | Jan. 16 | 5.19% |
| Sept. 7 | 4.62% | Dec. 11 | 5.22% |
Worst times for home buyers
On the flipside, home buyers face less opportune times to purchase property as well.
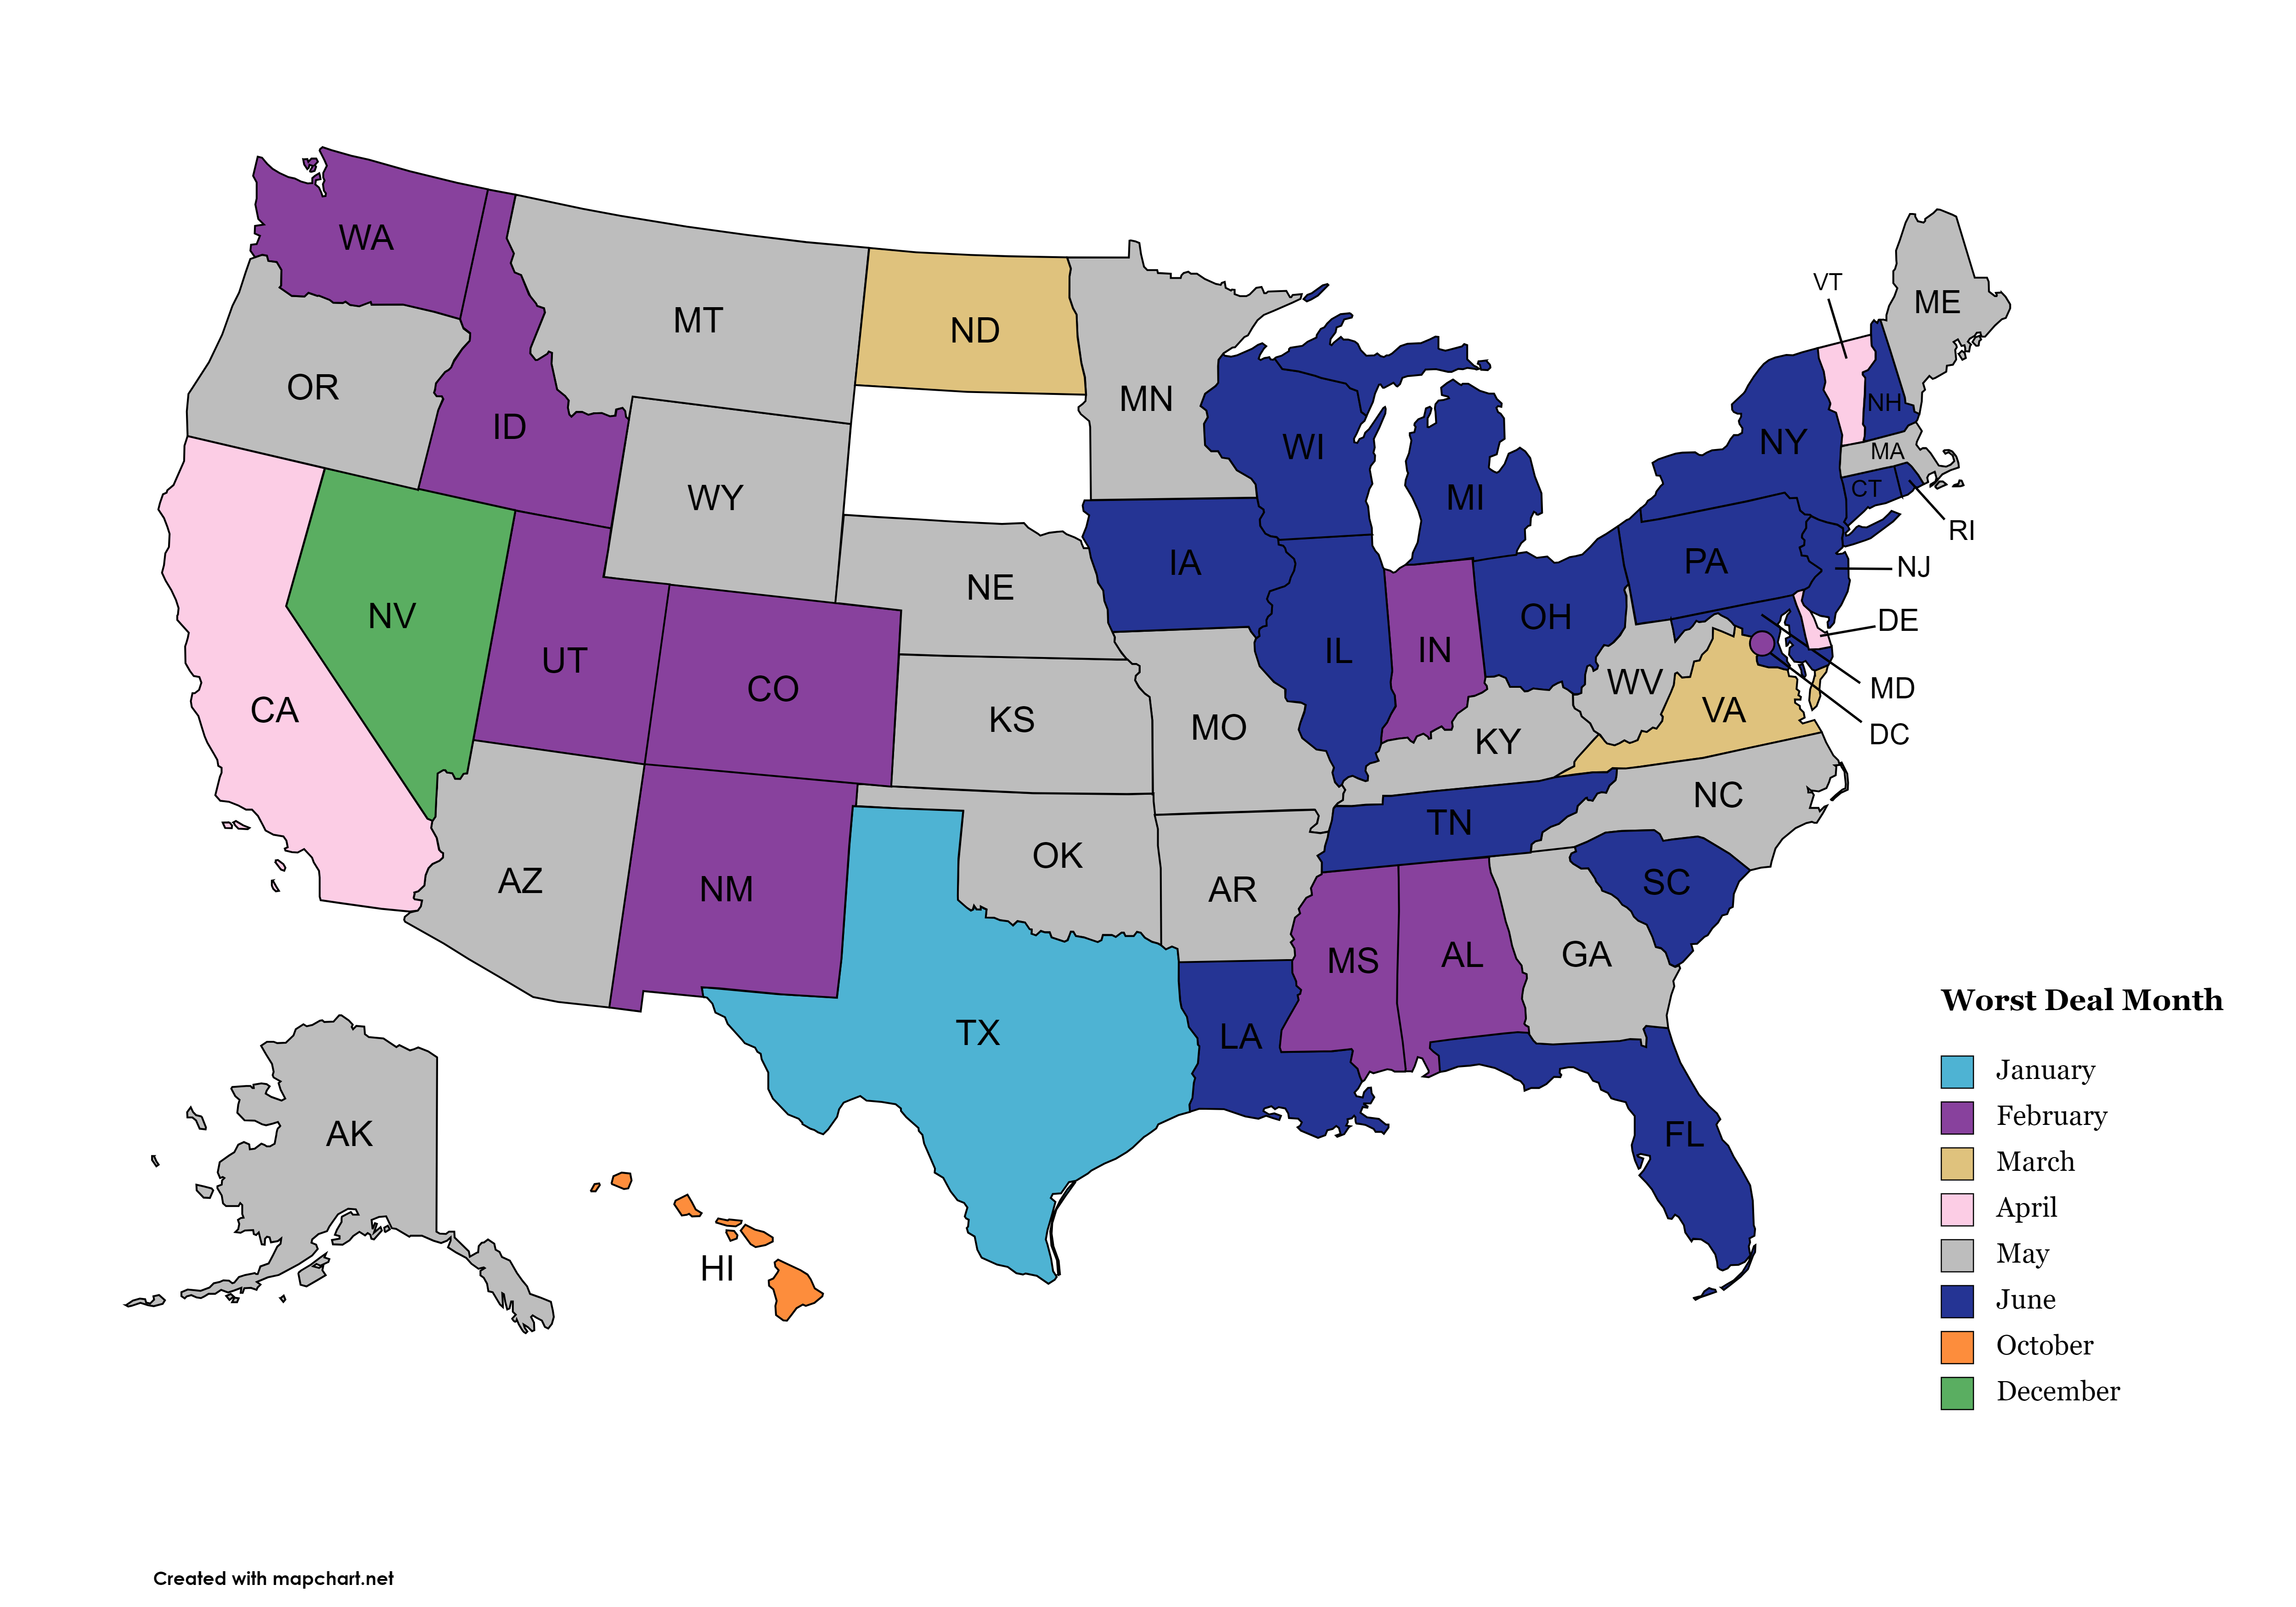
At the state level, February in Mississippi does house hunters no favors with a 106.81% premium. Montana’s 69.18% premium in May, West Virginia’s 41.4% in May, Wyoming’s 38.85% in February and North Dakota’s 37.59% in March rounded out the bottom five.
The chart below shows every state’s worst month for home buyers:

Overall, spring comes with the highest premiums for home buyers. May led the calendar with a 10.32% premium, followed by 9.76% in March and 9.65% in April. Fittingly, May accounted for half of the 12 most expensive days for borrowers, including the top two.
May 28 and 27 had the highest individual premiums of 14.35% and 13.23%, respectively. April 29 came next at 12.37%, then Feb. 25 at 11.93% and June 24 at 11.87%. Below are the bottom 12 days for home buying deals:
| Day | Premium | Day | Premium |
| May 28 | 14.35% | May 26 | 11.61% |
| May 27 | 13.23% | March 31 | 11.56% |
| April 29 | 12.37% | March 25 | 11.48% |
| Feb. 25 | 11.93% | May 24 | 11.36% |
| June 24 | 11.87% | May 31 | 11.36% |
| April 28 | 11.74% | May 20 | 11.27% |
The bottom line
Affordability continues to be a hurdle for prospective home buyers.
But that doesn’t mean there aren’t deals to be had. In addition to negotiating your mortgage rate, haggling the sales price, and applying for down payment assistance, knowing the best times to shop for a home can help save you money.
If you’re ready to become a homeowner, reach out to a local lender and get the process started.
Time to make a move? Let us find the right mortgage for you
